As part of building my data analyst portfolio, I decided to build a Tableau dashboard using dummy data from the domain that I am currently working (SEO). It was fun to be working in Tableau again as I have not touched Tableau for a while. This exercise helped me to recall many of the things that I was working with on a daily basis in my previous role.
I would like to share in brief the steps that I used to create this dashboard.
The first step was to gather requirements from the stakeholders which was done through several rounds of formal and informal discussions.
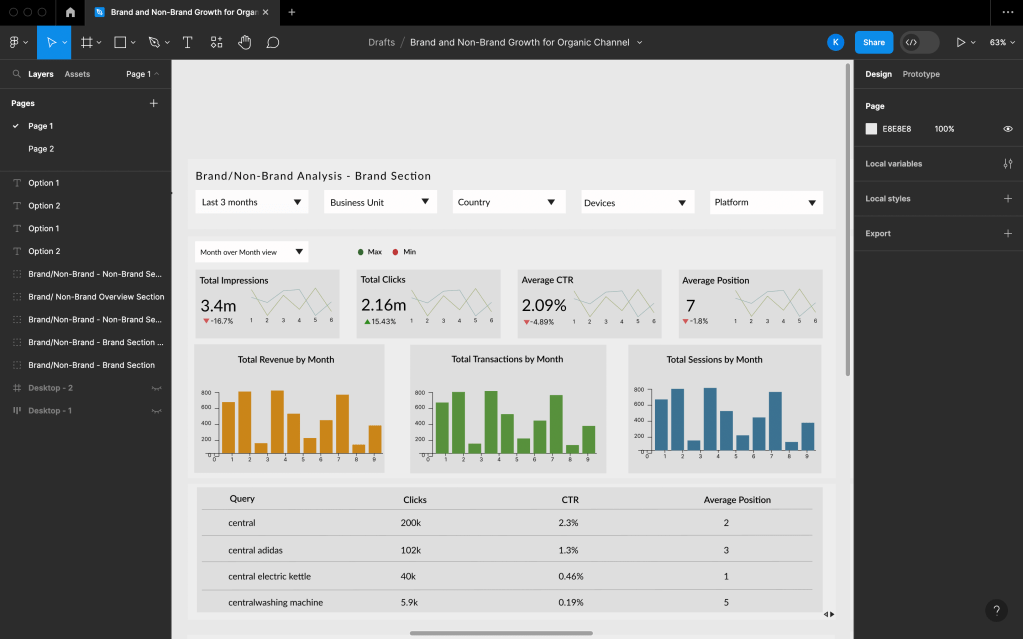
The second step was to design a prototype in Figma. The tool is absolutely easy to use so anyone can pick up the tool on the go. The following was created in Figma.
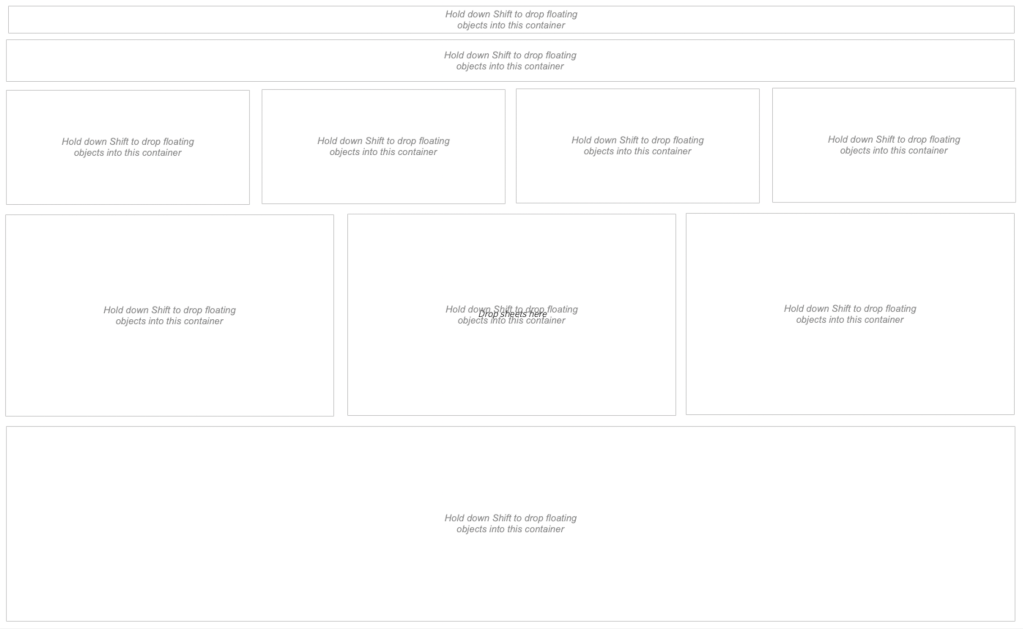
The third step was to first create the layout of the dashboard in Tableau which you can find below:
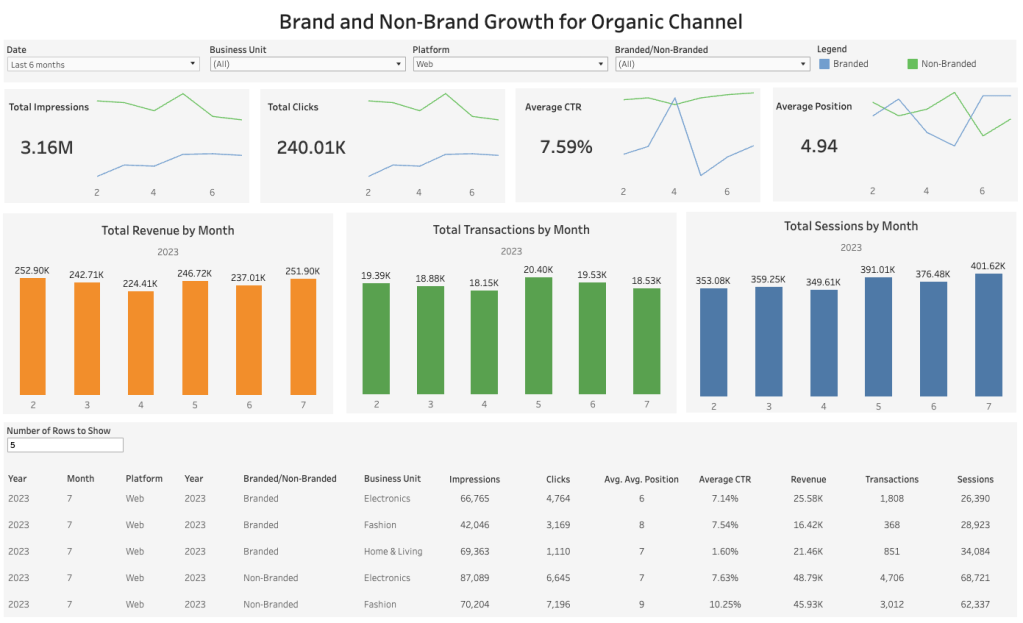
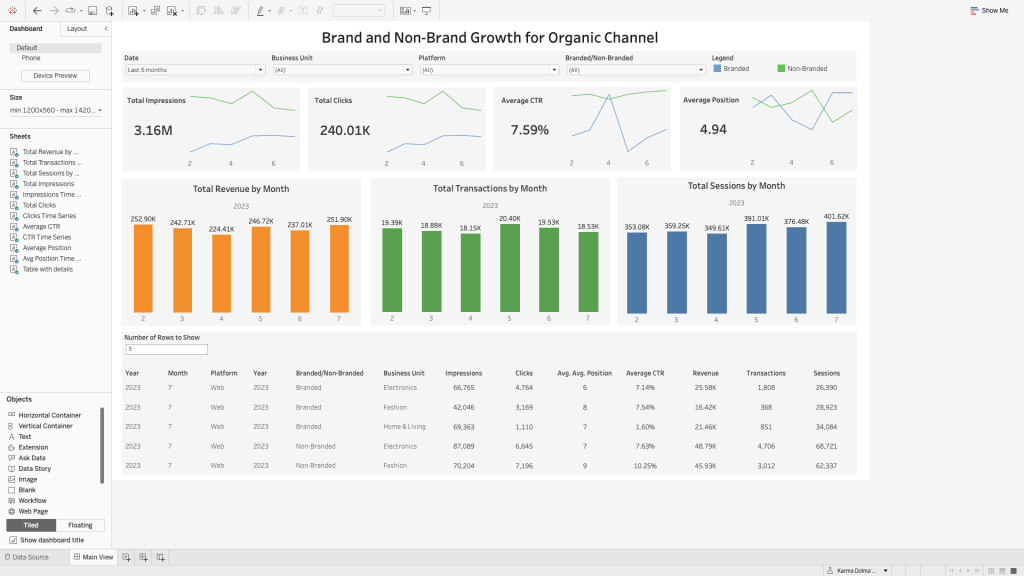
The final step was to create the dashboard objects and bring them all together so that the prototype can come to life which you can also find in this link here. You may find that I have not followed the prototype 100% as I had to make certain design decisions while working on creating the dashboard as is normally the case for most of the time.
Cheers,
Karma

Leave a comment